
I measured the gamma decay of various sources, such as 22-Na, 66-Co, 137-Cs, and 133-Ba. I also measured the gamma decay of 5 brazil nuts, which were surprisingly radioactive. I used a hyper-pure germanium detector that was kept at a temperature of 77K with liquid nitrogen. The detector consisted of a semiconductor, characterized by a conduction band and a valence band. If an electric field is applied, the electrons in the valence band are stuck and can’t increase their conductivity. But if we apply a change in temperature, the electrons can jump to the conduction band. Another way that electrons are liberated is when they’re hit with a gamma ray and are given some of the gamma’s kinetic energy. The gamma ray then scatters with the remainder of it’s kinetic energy and will either escape or hit another electron, repeating the process until it runs out of kinetic energy or escapes.
The detector sweeps up the liberated electron with a high voltage, and sends a pulse to the preamplifier. The detector was kept at a very low energy because the high voltage might excite other electrons thermally and “cover up” the pulse created by the gamma rays. The preamplifier creates a voltage pulse whose height is proportional to the energy of the liberated electrons. The preamp’s pulse is sent to an MCA, were it’s amplified and shaped before being measured. The MCA creates a histogram of channel vs counts, were a spread of channels corresponds to a pulse height and as a result to the energy of the gamma ray.
I first measured the gamma decay of 66-Cobalt, and found two peaks. Each peaks corresponded to single gamma rays with a defined kinetic energy KE. As a result, the peaks are also called photopeaks. The photopeaks also tell us that the gamma rays were fully captured, so all of their KE was passed onto the electrons. Since I didn’t know how the channel number was related to the energy of the gamma’s, I looked up what the energy values should be for this source. They were 1.173 MeV and 1.332 MeV.
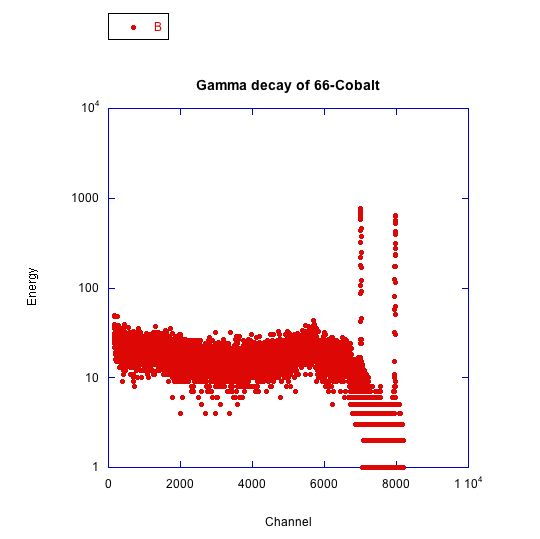
The peaks correspond to two fully captured gamma rays with different kinetic energies.
I also measured the gamma decay of 137-Cesium where the back scatter peak and the Compton edge were clearer than in 66-Co. When a gamma ray collides with an electron, it will “bounce” at an angle wrt its original trajectory. So if a gamma ray bounces back with a 180 degree angle, it is basically going back the way it came from. If the gamma ray manages to escape after a single collision, only a fraction of it’s KE is detected. The gamma ray can give the electron a maximum amount of KE, if it bounces back with a 180 degree angle. Therefore, on the spectrum we can see an edge that has a peak and falls off because the gamma has given the most KE it can without being absorbed. The backscattered peak occurs when the gamma scatters without being detected and then scatters again until it is fully absorbed. In fact the energy value of the backscattered peak equals the energy of the Compton edge subtracted from the energy value of the photopeak.
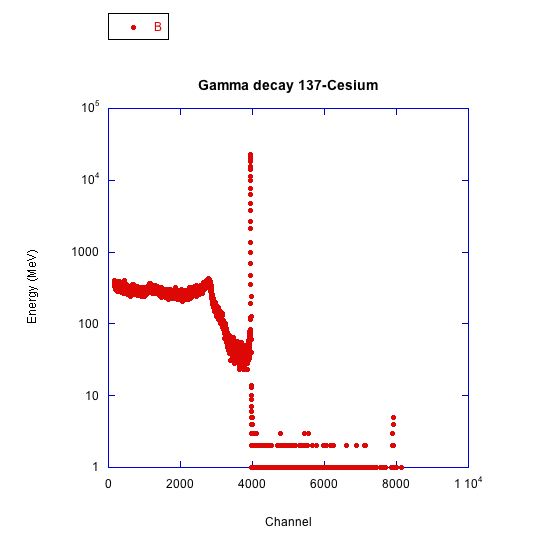
The Compton edge and the back scattered peak are well defined, and the photopeak corresponds to a fully captured gamma with a kinetic energy of 662 keV.
I also measured the gamma decay of Barium and sodium. I related the channel number to the KE value by looking up the KE of the photopeaks for each source. My data fit a line perfectly and I was able to identify the KE of any gamma decay measured by the detector I used.
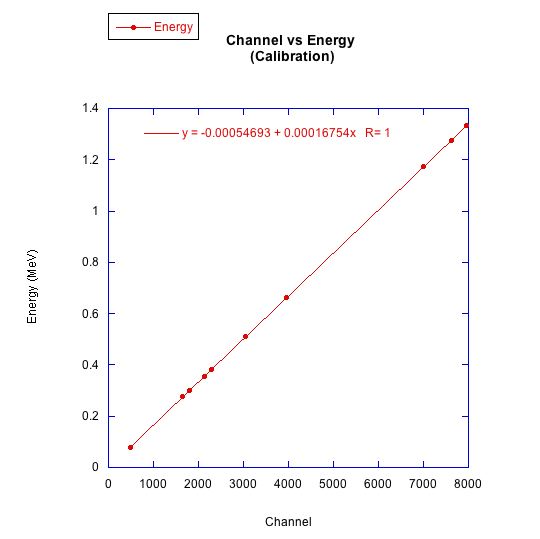
I used the given KE values for each source in order to find the relationship between the channel number and KE value. Note that it’s a perfect fit.
I wanted to measure the gamma decay of brazil nuts and find out what radioactive isotopes formed it. I had to measure the background radiation first, so that when I measured the radiation of the brazil nuts I could tell which peaks were due to background radiation. Since the background radiation was so “weak” I had to leave the detector running for 24 hrs.
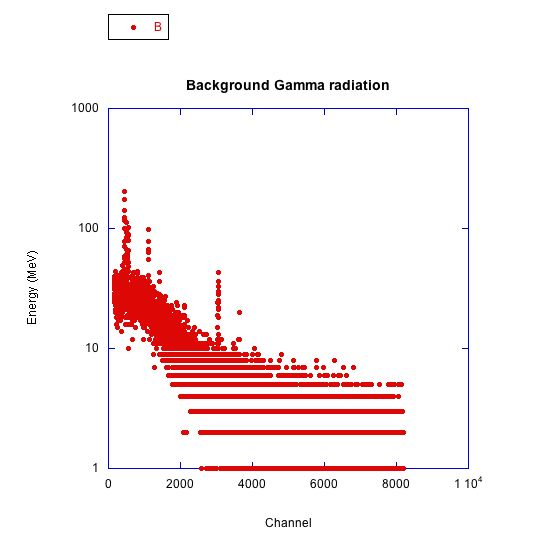
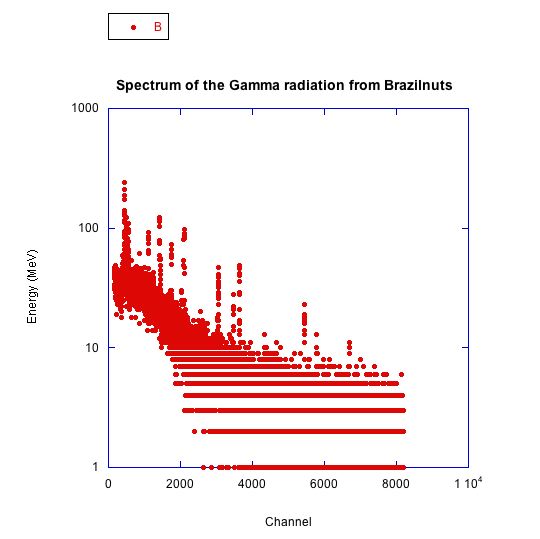
Note that there were at least three major photopeaks, and that there were few gamma rays present with a high KE value
I then measured the gamma radiation of brazil nuts for 24 hrs. The photopeaks that were present in the background spectrum also showed up, so I was able to weed them out. I found that the remaining photopeaks corresponded to Radium-224, Potasium-43 and Protactinium-234. Further analysis might show that brazil nuts contain other radioactive isotopes as well.
Observe that there are more photopeaks than in the background spectrum. These peaks corresponded to the radioactive isotopes within the brazil nuts